Barn Jams!
On this page you will learn about nuclear cross sections. To make it a more multimedia experience, we’ve added a gimmick that allows you to listen to each cross section plot as if it were sound. While making sound out of these doesn’t make any physical sense, it’s a fun way to get people to explore the variety of shapes. Look and listen to these and then scroll down to learn about what they mean.
So, what am I looking at here?
Let’s start with some background. If you like talking about nuclear reactors, you might know that there are two isotopes of Uranium found in nature, and that the rare Uranium-235 readily fissions and releases energy when it encounters a neutron of any energy, while the more common Uranium-238 does not. This is why most nuclear reactors require enrichment; to increase the concentration of U-235. Nuclear cross section are the details of the interaction probabilities between neutrons and nuclei of various atoms.
When a neutron strikes a nucleus, a variety of interactions may occur:
- The neutron might bounce (or scatter) off like a billiards ball, transferring some of its energy to the nucleus
- The neutron might get captured by the nucleus, forming a larger nucleus
- The neutron might knock one or more subatomic particles (neutrons, alpha particles, protons, etc.) out of the nucleus
- The neutron might fission the whole nucleus into two or more smaller pieces
You can never know exactly which of these interactions will happen in any particular encounter, but you can know what will happen on average. In other words, if you shoot a million neutrons at a bunch of nuclei, you can figure out how many of each interaction type will occur.
How do you figure it out? You measure the probabilities with experiments. Simply put, you just shoot neutrons of varying speeds at various materials and count how many interactions of each type occur.
Nuclear physicists think of the probabilities as cross-sectional area the nucleus has for each interaction. If the fission probability is large, then the nucleus’s cross section for fission is large. During the classified early days of the Manhattan Project, some physicists agreed on units of barns as ways to measure nuclear cross sections without giving away secrets of their work [1]. The unit is defined as 10-24 cm2, which was said to be "as big as a barn," by which they meant that an interaction of this cross section was decidedly likely to occur.
Nuclear data
Gaps in measured cross sections are typically filled-in using theoretical nuclear models, allowing the creation of smooth curves of interaction probability vs. the energy of the incoming neutron. There is a huge amount of work that goes into choosing the best averages of measured data and fitting the nuclear models to the results. Such nuclear data evaluations are performed by various organizations such as CSWEG [2]. The results of an evaluation are distributed broadly to nuclear physicists, reactor designers, and all sorts of other people who use the information in their computer models. Thus, nuclear data is the connection between fundamental nuclear physics and the applications of nuclear engineering.

Cross sections for U-235 fission
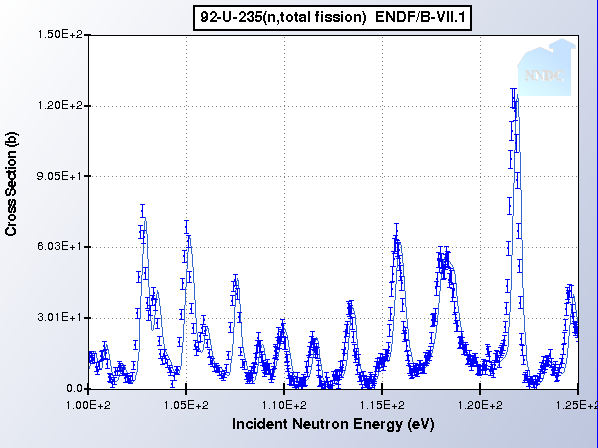
This plot shows the fission cross section of U-235 for neutrons with energies between 100 and 120 electron-Volts (eV). Shown are measured data points from Weston, 1992, as well as the smooth line from the ENDF/B-VII.1 evaluation (which uses nuclear models to fill in experimental gaps). You can browse the latest US data evaluation over at the National Nuclear Data Center [3].Notable features of some cross sections
You’ll notice in the first two plots that the U-235 fission cross section is much higher than the U-238 fission cross section. This means U-235 fissions more often. You’ll also notice that the fission and absorption cross sections are high at low energy. The high probability of U-235 fission from slow neutrons is why slow-neutron reactors (aka thermal reactors) were the only ones possible before enrichment was invented. You can also see that capture (gamma) cross sections tend to get small at very high energy, while the fission cross sections level off. This is a general trend among most actinides and is part of the reason that fast reactors often have enough extra neutrons to be breeder reactors.
Also note that the resonances tend to get closer and closer together as we go to higher energy. Eventually, all resonances just stop and there appears to be a smooth line. The resonances don’t actually stop there. They just get so close together that we can’t know the details of them, so the smooth line is just an average. That is called the unresolved resonance region.
References
- M.G.Holloway, C.P. Baker "How the Barn was Born", Physics Today, p. 9 July 1972.
- Cross Section Evaluation Working Group (CSEWG)
- Evaluated Nuclear Data File (ENDF) Retrieval & Plotting
